Multiple Choice
Figure 13-1. The figure depicts a demand-for-loanable-funds curve and two supply-of-loanable-funds curves. 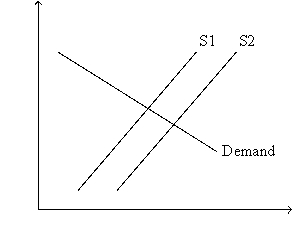
-Refer to Figure 13-1. What is measured along the vertical axis of the graph?
A) the nominal interest rate
B) the real interest rate
C) the quantity of investment
D) the quantity of saving
Correct Answer:

Verified
Correct Answer:
Verified
Q4: In a closed economy,what remains after paying
Q22: Banks<br>A)play a role in creating an asset
Q42: We interpret the meaning of "loanable funds"
Q58: Skeptics of government policy to reduce taxes
Q85: All else equal,when people become more optimistic
Q93: Which of the following is included in
Q117: When the U.S. government is in debt
Q129: The slope of the demand for loanable
Q140: Bolivia had a smaller budget deficit in
Q334: For an imaginary closed economy, T =