Multiple Choice
Figure 13-1. The figure depicts a demand-for-loanable-funds curve and two supply-of-loanable-funds curves. 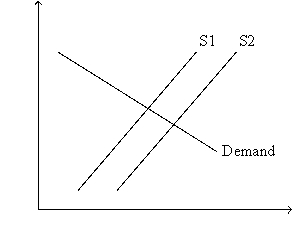
-Refer to Figure 13-1. Which of the following events would shift the supply curve from S1 to S2?
A) In response to tax reform, firms are encouraged to invest more than they previously invested.
B) In response to tax reform, households are encouraged to save more than they previously saved.
C) Government goes from running a balanced budget to running a budget deficit.
D) Any of the above events would shift the supply curve from S1 to S2.
Correct Answer:

Verified
Correct Answer:
Verified
Q2: Lenders buy bonds and borrowers sell them.
Q17: Which of the following policy changes would
Q33: If the nominal interest rate is 7
Q49: Which of the following involves financial intermediation?<br>A)a
Q71: Other things the same, as the maturity
Q94: Which of the following is not correct?<br>A)Gross
Q154: Generally, if people begin to expect a
Q170: Suppose a country repealed its investment tax
Q212: Public saving is T - G, while
Q484: If a firm's price-earnings ratio is relatively