Multiple Choice
Figure 13-3. The figure shows two demand-for-loanable-funds curves and two supply-of-loanable-funds curves. 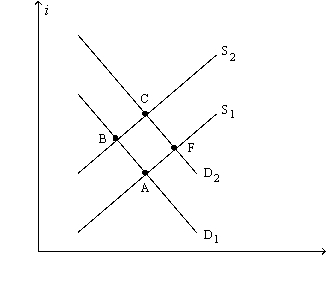
-Refer to Figure 13-3. What, specifically, does the label on the vertical axis, i, represent?
A) the nominal interest rate
B) the real interest rate
C) the inflation rate
D) the dividend yield
Correct Answer:

Verified
Correct Answer:
Verified
Q12: In 2002 mortgage rates fell and mortgage
Q24: When a firm wants to borrow directly
Q59: Stock represents<br>A)a claim to a share of
Q136: When a large,well-known corporation wishes to borrow
Q138: In the late summer of 2005 some
Q171: If the government currently has a budget
Q193: If the quantity of loanable funds demanded
Q199: Because of differences in tax treatment, municipal
Q215: If the demand for loanable funds shifts
Q218: Camp Company had total earnings of $600