Multiple Choice
Figure 13-3. The figure shows two demand-for-loanable-funds curves and two supply-of-loanable-funds curves. 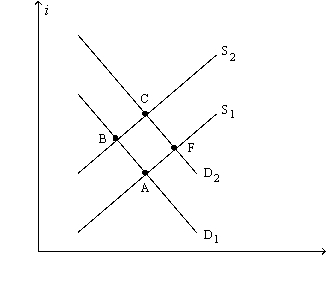
-Refer to Figure 13-3. A shift of the supply curve from S1 to S2 is called
A) an increase in the supply of loanable funds.
B) an increase in the quantity of loanable funds supplied.
C) a decrease in the supply of loanable funds.
D) a decrease in the quantity of loanable funds supplied.
Correct Answer:

Verified
Correct Answer:
Verified
Q10: What would happen in the market for
Q70: If a reform of the tax laws
Q78: If there is shortage of loanable funds,
Q87: On a graph that depicts the market
Q97: In a closed economy, public saving is
Q101: At some point during the financial crisis
Q105: A high demand for a company's stock
Q148: Suppose the Move It! exercise chain has
Q182: Figure 13-2. The figure depicts a supply-of-loanable-funds
Q611: If an economy is closed and if