Multiple Choice
Figure 13-3. The figure shows two demand-for-loanable-funds curves and two supply-of-loanable-funds curves. 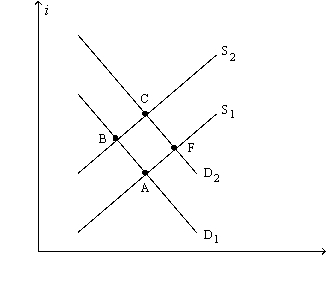
-Refer to Figure 13-3. A shift of the demand curve from D1 to D2 is called
A) an increase in the demand for loanable funds, and that increase would originate from people who had some extra income they wanted to lend.
B) an increase in the demand for loanable funds, and that increase would originate from households and firms who wish to borrow to make investments.
C) a decrease in the demand for loanable funds, and that decrease would originate from people who had some extra income they wanted to lend.
D) a decrease in the demand for loanable funds, and that decrease would originate from households and firms who wish to borrow to make investments.
Correct Answer:

Verified
Correct Answer:
Verified
Q13: Suppose a government that taxed all interest
Q14: A high price-earnings ratio for a stock
Q75: Which of the following would be included
Q100: Which of the following statements is correct?<br>A)Stocks,bonds,and
Q115: Which of the following statements is correct?<br>A)A
Q155: As real interest rates fall,firms desire to<br>A)buy
Q159: World Wide Delivery Service Corporation develops a
Q250: In the small closed economy of San
Q252: If a share of stock in Skylight
Q256: If the nominal interest rate is 5