Multiple Choice
Figure 13-4. On the horizontal axis of the graph, L represents the quantity of loanable funds in billions of dollars. 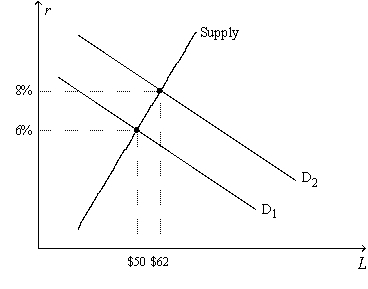
-Refer to Figure 13-4. Which of the following events could explain a shift of the demand-for-loanable-funds curve from to ?
A) The tax code is reformed to encourage greater saving.
B) The tax code is reformed to encourage greater investment.
C) The government starts running a budget deficit.
D) The government starts running a budget surplus.
Correct Answer:

Verified
Correct Answer:
Verified
Q28: Assume the bonds below have the same
Q30: A U.S.Treasury bond is a<br>A)store of value
Q39: Which of the following is correct?<br>A)Lenders sell
Q48: Other things the same, the higher the
Q90: Index funds<br>A)typically have a higher rate of
Q95: Which of the following both make the
Q121: Which of the following is not an
Q174: The sale of stocks<br>A)and bonds to raise
Q194: If Congress instituted an investment tax credit,
Q195: Which of the following events could explain