Multiple Choice
Figure 13-4. On the horizontal axis of the graph, L represents the quantity of loanable funds in billions of dollars. 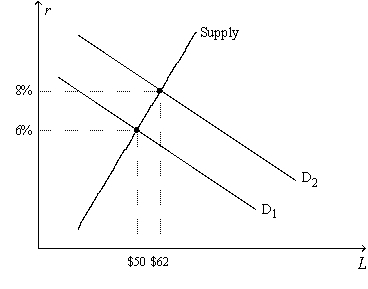
-Refer to Figure 13-4. The position and/or slope of the Supply curve are influenced by
A) the level of public saving.
B) the level of national saving.
C) decisions made by people who have extra income they want to save and lend out.
D) All of the above are correct.
Correct Answer:

Verified
Correct Answer:
Verified
Q18: According to the definitions of national saving
Q47: When a corporation experiences financial problems, bondholders
Q55: Which of the following would a macroeconomist
Q79: Compared to stocks,bonds offer the holder<br>A)lower risk
Q102: In a closed economy, investment must be
Q113: Using a graph representing the market for
Q126: Suppose that in a closed economy GDP
Q130: In 2008, XYZ Corporation had total earnings
Q149: Which of the following is a certificate
Q201: Lenders sell bonds and borrowers buy them.