Multiple Choice
Figure 13-4. On the horizontal axis of the graph, L represents the quantity of loanable funds in billions of dollars. 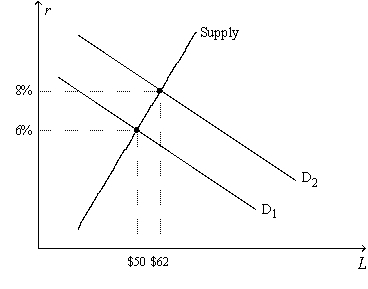
-Refer to Figure 13-4. Regard the position of the Supply curve as fixed, as on the graph. If the real interest rate is 4 percent, the inflation rate is 2 percent, and the market for loanable funds is in equilibrium, then the position of the demand-for-loanable-funds curve must be
A) D1
B) D2
C) betweenD1andD2
D) to the left of D1
Correct Answer:

Verified
Correct Answer:
Verified
Q7: Given that Monika's income exceeds her expenditures,Monika
Q18: In a closed economy, if taxes fall
Q21: Table 13-2<br> <span class="ql-formula" data-value="\begin{array}
Q25: If a firm wants to borrow it
Q29: In examining the national income accounts of
Q30: Figure 13-4. On the horizontal axis of
Q31: Table 13-2<br> <span class="ql-formula" data-value="\begin{array}
Q62: Suppose the government finds a major defect
Q127: Which of the two bonds in each
Q148: Volume,as reported in stock tables,refers to the<br>A)number