Multiple Choice
Figure 13-4. On the horizontal axis of the graph, L represents the quantity of loanable funds in billions of dollars. 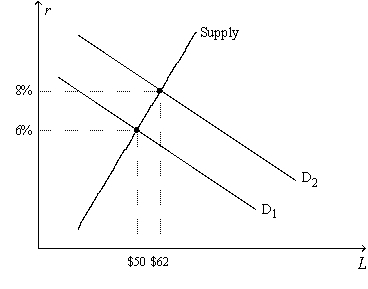
-Refer to Figure 13-4. If the equilibrium quantity of loanable funds is $56 billion and if the rate of inflation is 4 percent, then the equilibrium real interest rate is
A) lower than 6 percent..
B) 6 percent.
C) between 6 percent and 8 percent.
D) higher than 8 percent.
Correct Answer:

Verified
Correct Answer:
Verified
Q9: Suppose Sarah Lee Corporation stock has a
Q70: If a reform of the tax laws
Q97: In a closed economy, public saving is
Q117: If the government instituted an investment tax
Q123: Which of the following is correct?<br>A)Joan takes
Q148: Suppose the Move It! exercise chain has
Q156: When a firm wants to borrow directly
Q167: Which of the following events could explain
Q175: If Japan goes from a small budget
Q182: Figure 13-2. The figure depicts a supply-of-loanable-funds