Multiple Choice
Figure 13-4. On the horizontal axis of the graph, L represents the quantity of loanable funds in billions of dollars. 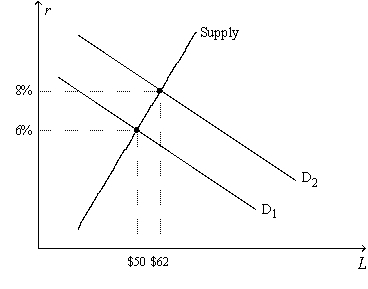
-Refer to Figure 13-4. If the equilibrium quantity of loanable funds is $56 billion and if the rate of inflation is 5 percent, then the equilibrium nominal interest rate is
A) lower than 6 percent..
B) approximately 6 percent.
C) between 6 percent and 8 percent.
D) approximately 12 percent.
Correct Answer:

Verified
Correct Answer:
Verified
Q3: Which of the following is a financial
Q6: The primary economic function of the financial
Q21: According to the definitions of private and
Q25: The purchase of a new house is
Q40: Which of the following is correct?<br>A)In the
Q69: Municipal bonds pay a relatively<br>A)low rate of
Q74: The bond market,the stock market,banks,pension funds,and insurance
Q120: A certificate of indebtedness that specifies the
Q164: The conventions of national income accounting imply
Q206: An increase in the demand for loanable