Multiple Choice
Figure 17-2. On the graph, MS represents the money supply and MD represents money demand. The usual quantities are measured along the axes. 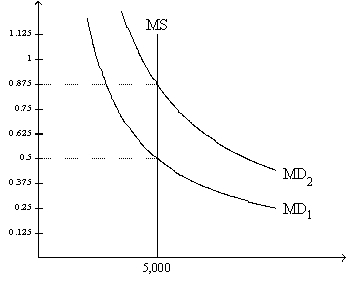
-Refer to Figure 17-2. If the relevant money-demand curve is the one labeled MD1, then the equilibrium value of money is
A) 0.5 and the equilibrium price level is 2.
B) 2 and the equilibrium price level is 0.5.
C) 0.5 and the equilibrium price level cannot be determined from the graph.
D) 2 and the equilibrium price level cannot be determined from the graph.
Correct Answer:

Verified
Correct Answer:
Verified
Q3: The value of money rises as the
Q32: When inflation rises,firms make<br>A)more frequent price changes.This
Q90: Wealth is redistributed from creditors to debtors
Q138: The story The Wizard of Oz can
Q176: The principle of monetary neutrality implies that
Q345: You bought some shares of stock and,
Q347: When the money market is drawn with
Q348: If velocity = 5, the price level
Q349: Over the past 70 years, prices in
Q355: Suppose monetary neutrality holds and velocity is