Multiple Choice
Figure 17-2. On the graph, MS represents the money supply and MD represents money demand. The usual quantities are measured along the axes. 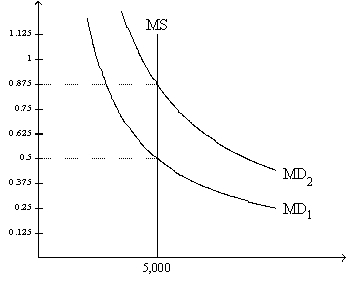
-Refer to Figure 17-2. Which of the following events could explain a shift of the money-demand curve from MD1 to MD2?
A) an increase in the value of money
B) a decrease in the price level
C) an open-market purchase of bonds by the Federal Reserve
D) None of the above is correct.
Correct Answer:

Verified
Correct Answer:
Verified
Q1: Serena purchased 10 shares of GLC,Inc.stock for
Q4: Steve purchases some land for $30,000.He maintains
Q41: Kaitlyn purchased one share of Northwest Energy
Q51: Suppose the nominal interest rate is 5
Q53: An excess supply of money is eliminated
Q67: Tara deposits money into an account with
Q93: You bought some shares of stock and,over
Q110: The money supply is 4,000, nominal GDP
Q166: If the Fed increases the money supply,then
Q180: When the money market is drawn with