Multiple Choice
Figure 21-5. On the figure, MS represents money supply and MD represents money demand. 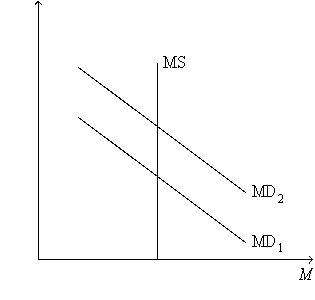
-Refer to Figure 21-5. What is measured along the vertical axis of the graph?
A) the quantity of output
B) the amount of crowding out
C) the interest rate
D) the price level
Correct Answer:

Verified
Correct Answer:
Verified
Q7: In the long run,fiscal policy influences<br>A)saving,investment,and growth;in
Q47: Which of the following tends to make
Q61: Suppose an economy's marginal propensity to consume
Q96: An essential piece of the liquidity preference
Q125: If there is excess money supply,people will<br>A)deposit
Q271: An increase in government purchases is likely
Q273: Assume the multiplier is 5 and that
Q276: Suppose there are both multiplier and crowding
Q277: Figure 21-2. On the left-hand graph, MS
Q279: If, at some interest rate, the quantity