Multiple Choice
Figure 21-5. On the figure, MS represents money supply and MD represents money demand. 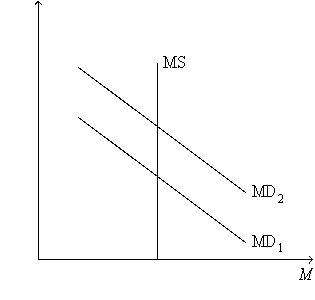
-Refer to Figure 21-5. A shift of the money-demand curve from MD1 to MD2 could be a result of
A) a decrease in taxes.
B) an increase in government spending.
C) an increase in the price level.
D) All of the above are correct.
Correct Answer:

Verified
Correct Answer:
Verified
Q11: Describe the process in the money market
Q22: The Kennedy tax cut of 1964 was<br>A)successful
Q34: It is likely that a constitutional amendment
Q42: The most important automatic stabilizer is<br>A)open-market operations.<br>B)the
Q88: When government expenditures increase,the interest rate<br>A)increases,making the
Q126: Figure 21-2. On the left-hand graph, MS
Q128: The Fed can influence the money supply
Q132: According to liquidity preference theory, investment spending
Q177: The wealth effect stems from the idea
Q431: In the long run, fiscal policy primarily