Multiple Choice
Figure 22-3. The left-hand graph shows a short-run aggregate-supply (SRAS) curve and two aggregate-demand (AD) curves. On the left-hand diagram, Y represents output and on the right-hand diagram, U represents the unemployment rate. 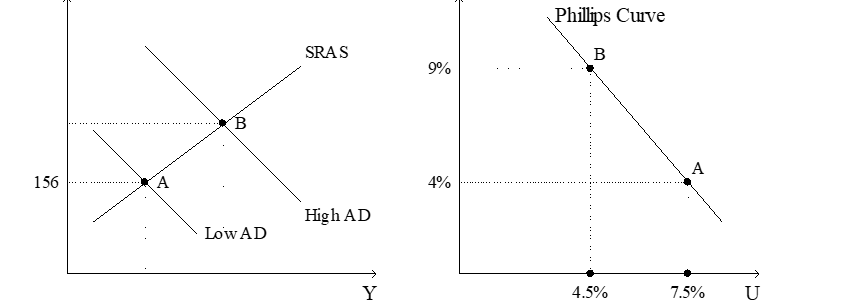
-Refer to Figure 22-3. What is measured along the vertical axis of the left-hand graph?
A) the wage rate
B) the inflation rate
C) the price level
D) the change in output from one year to the next
Correct Answer:

Verified
Correct Answer:
Verified
Q3: Friedman and Phelps argued that<br>A)if peoples' inflation
Q10: In the long run,<br>A)the natural rate of
Q32: A favorable supply shock causes output to<br>A)rise.To
Q41: In the short run,policy that changes aggregate
Q48: In 1968,economist Milton Friedman published a paper
Q100: If a government redesigned its unemployment insurance
Q102: Which of the following would shift the
Q109: Closely watched indicators such as the inflation
Q126: Suppose the central bank pursues an unexpectedly
Q134: According to the Friedman-Phelps analysis, in the