Multiple Choice
Figure 22-3. The left-hand graph shows a short-run aggregate-supply (SRAS) curve and two aggregate-demand (AD) curves. On the left-hand diagram, Y represents output and on the right-hand diagram, U represents the unemployment rate. 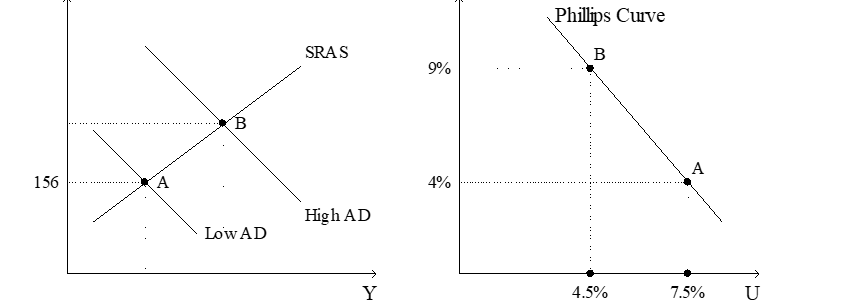
-Refer to Figure 22-3. What is measured along the vertical axis of the right-hand graph?
A) the interest rate
B) the inflation rate
C) the government's budget deficit as a percent of GDP
D) the growth rate of the nominal money supply
Correct Answer:

Verified
Correct Answer:
Verified
Q12: In response to the financial crisis of
Q20: Which of the following describes the Volcker
Q51: Suppose that the Prime Minister and Parliament
Q52: An event that directly affects firms' costs
Q87: The consequences of the Volcker disinflation demonstrated
Q90: If the Federal Reserve decreases the rate
Q119: If the government reduced the minimum wage
Q134: A movement to the right along a
Q215: Sticky wages leads to a positive relationship
Q279: Assume the analysis of Friedman and Phelps