Multiple Choice
Figure 22-5
Use the graph below to answer the following questions. 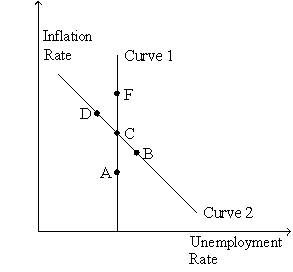
-Refer to Figure 22-5. The money supply growth rate is greatest at
A) A.
B) B.
C) C.
D) F.
Correct Answer:

Verified
Correct Answer:
Verified
Related Questions
Q16: Samuelson and Solow believed that the Phillips
Q19: If the natural rate of unemployment falls,<br>A)both
Q53: If policymakers accommodate an adverse supply shock,then
Q74: Proponents of rational expectations argue that failing
Q81: Samuelson and Solow argued that a combination
Q129: According to Friedman and Phelps,the unemployment rate
Q321: In the short run,<br>A)unemployment and inflation are
Q322: Monetary Policy in Highland<br>Highland has had inflation
Q323: Figure 22-8. The left-hand graph shows a
Q328: Figure 22-6<br>Use the two graphs in the