Multiple Choice
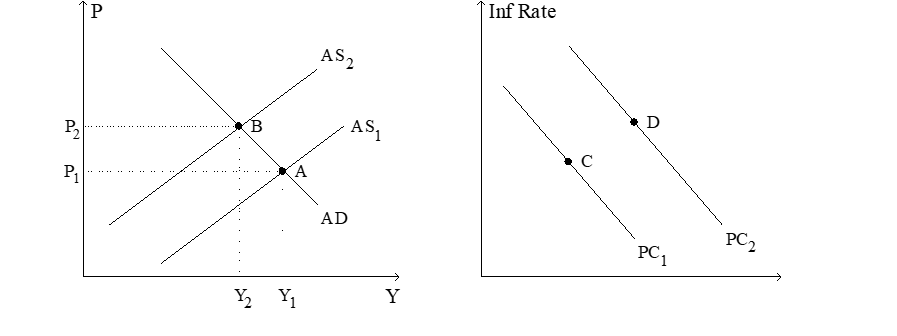
Figure 22-8. The left-hand graph shows a short-run aggregate-supply (SRAS) curve and two aggregate-demand (AD) curves. On the right-hand diagram, "Inf Rate" means "Inflation Rate." 
-Refer to Figure 22-8. What is measured along the horizontal axis of the right-hand graph?
A) time
B) the unemployment rate
C) real GDP
D) the growth rate of real GDP
Correct Answer:

Verified
Correct Answer:
Verified
Q2: Prime Minister Emma Bigshot urges passage of
Q22: The restrictive monetary policy followed by the
Q22: Figure 22-2<br>Use the pair of diagrams below
Q26: Phillips found a negative relation between<br>A)output and
Q28: Figure 22-6<br>Use the two graphs in the
Q32: Natural rate of unemployment - a *
Q44: The short-run relationship between inflation and unemployment
Q68: If policymakers decrease aggregate demand,then in the
Q144: Suppose that the central bank unexpectedly increases
Q158: According to the long-run Phillips curve, in