Multiple Choice
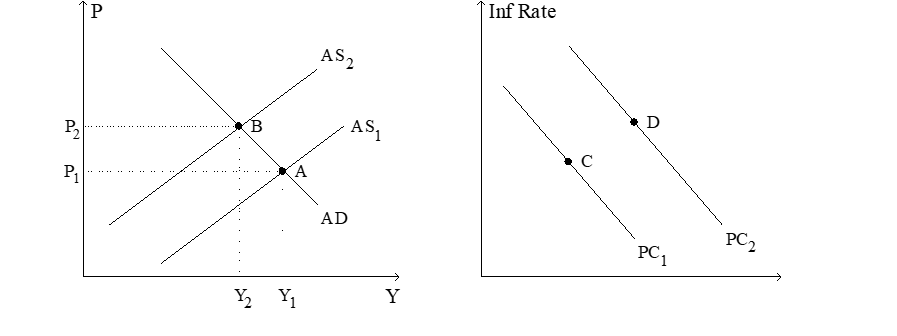
Figure 22-8. The left-hand graph shows a short-run aggregate-supply (SRAS) curve and two aggregate-demand (AD) curves. On the right-hand diagram, "Inf Rate" means "Inflation Rate." 
-Refer to Figure 22-8. The shift of the aggregate-supply curve from AS1 to AS2
A) results in a more favorable trade-off between inflation and unemployment.
B) results in a more favorable trade-off between inflation and the growth rate of real GDP.
C) represents an adverse shock to aggregate supply.
D) represents a favorable shock to aggregate supply.
Correct Answer:

Verified
Correct Answer:
Verified
Q5: An increase in the natural rate of
Q23: When they are confronted with an adverse
Q39: Which of the following would tend to
Q54: A favorable supply shock<br>A)raises unemployment and the
Q63: An adverse supply shock shifts the short-run
Q77: Other things the same, if the Fed
Q118: The classical notion of monetary neutrality is
Q190: Contractionary monetary policy<br>A)leads to disinflation and makes
Q352: Figure 22-5<br>Use the graph below to answer
Q482: Which of the following depends primarily on