Multiple Choice
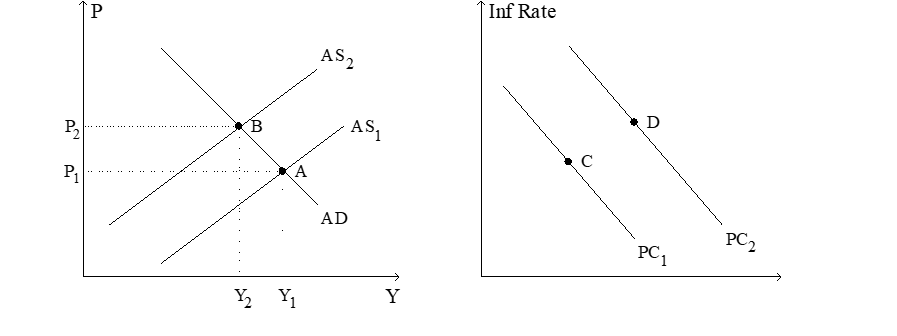
Figure 22-8. The left-hand graph shows a short-run aggregate-supply (SRAS) curve and two aggregate-demand (AD) curves. On the right-hand diagram, "Inf Rate" means "Inflation Rate." 
-Refer to Figure 22-8. Which of the following events could explain the shift of the aggregate-supply curve from AS1 to AS2?
A) a reduction in firms' costs of production
B) a reduction in taxes on consumers
C) an increase in the price level
D) an increase in the world price of oil
Correct Answer:

Verified
Correct Answer:
Verified
Q10: If the long-run Phillips curve shifts to
Q16: Samuelson and Solow believed that the Phillips
Q36: If the short-run Phillips curve were stable,which
Q74: Proponents of rational expectations argue that failing
Q76: There is a<br>A)short-run tradeoff between inflation and
Q124: By raising aggregate demand more than anticipated,policymakers<br>A)reduce
Q135: A central bank announces it will decrease
Q178: If the minimum wage increased, then at
Q335: If the sacrifice ratio is 2, reducing
Q338: Figure 22-5<br>Use the graph below to answer