Multiple Choice
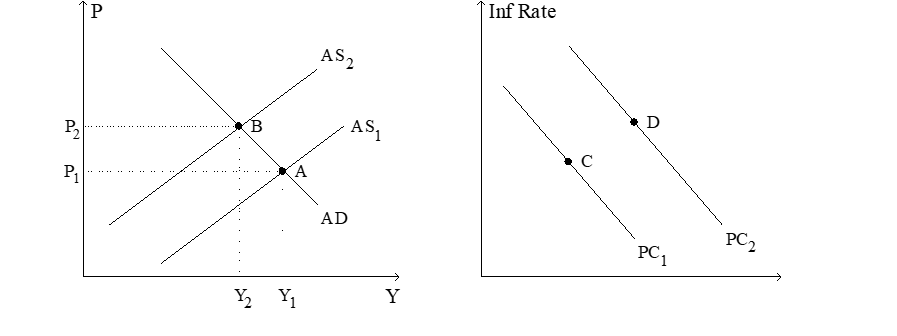
Figure 22-8. The left-hand graph shows a short-run aggregate-supply (SRAS) curve and two aggregate-demand (AD) curves. On the right-hand diagram, "Inf Rate" means "Inflation Rate." 
-Refer to Figure 22-8. A significant increase in the world price of oil could explain
A) the shift of the aggregate-supply curve from AS1 to AS2, but it could not explain the shift of the Phillips curve from PC1 to PC2.
B) the shift of the Phillips curve from PC1 to PC2, but it could not explain the shift of the aggregate-supply curve from AS1 to AS2.
C) both the shift of the aggregate-supply curve from AS1 to AS2 and the shift of the Phillips curve from PC1 to PC2.
D) neither the shift of the aggregate-supply curve from AS1 to AS2 nor the shift of the Phillips curve from PC1 to PC2.
Correct Answer:

Verified
Correct Answer:
Verified
Q1: A favorable supply shock will cause inflation
Q10: In the long run,<br>A)the natural rate of
Q10: A.W.Phillips' findings were based on data<br>A)from 1861-1957
Q32: A favorable supply shock causes output to<br>A)rise.To
Q93: Which of the following implies that an
Q115: Monetary Policy in Southland<br>In Southland the Department
Q120: Monetary Policy in Southland<br>In Southland the Department
Q141: A central bank can reduce inflation by
Q160: In the long run,if the Fed decreases
Q212: Disinflation is defined as a<br>A)zero rate of