Multiple Choice
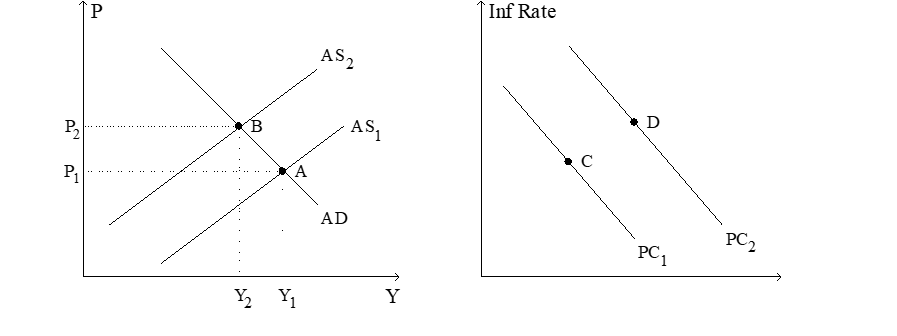
Figure 22-8. The left-hand graph shows a short-run aggregate-supply (SRAS) curve and two aggregate-demand (AD) curves. On the right-hand diagram, "Inf Rate" means "Inflation Rate." 
-Refer to Figure 22-8. Faced with the shift of the Phillips curve from PC1 to PC2, policymakers will
A) ask whether the shift is temporary or permanent.
B) be concerned with how people adjust their expectations of inflation as a result of the shift.
C) face, as well, a decision as to whether to accommodate the shock.
D) All of the above are correct.
Correct Answer:

Verified
Correct Answer:
Verified
Q7: In his famous article published in an
Q7: Suppose that the economy is at an
Q34: Which of the following would not be
Q39: In the 1970s,the Fed accommodated a(n)<br>A)adverse supply
Q39: Which of the following shifts the long-run
Q52: On a given short-run Phillips curve which
Q75: In 2007 and 2008 households and firms
Q76: If the Federal Reserve increases the rate
Q111: If expected inflation increases,which of the following
Q144: Other things the same, if there is