Multiple Choice
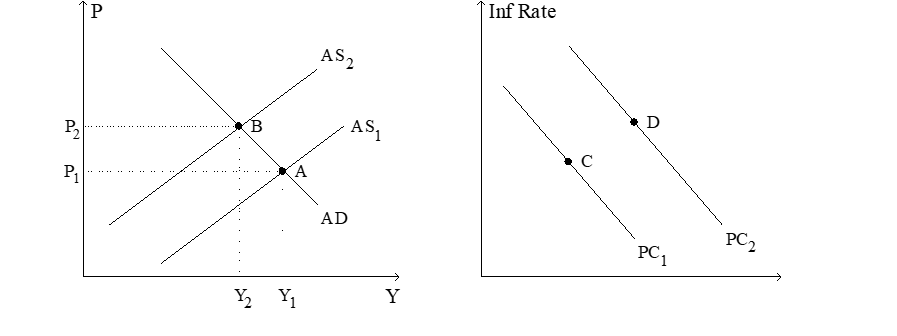
Figure 22-8. The left-hand graph shows a short-run aggregate-supply (SRAS) curve and two aggregate-demand (AD) curves. On the right-hand diagram, "Inf Rate" means "Inflation Rate." 
-Refer to Figure 22-8. A movement of the economy from point A to point B, and at the same time a movement from point C to point D, would be described as
A) the outcome of a favorable supply shock.
B) falling inflation.
C) stagflation.
D) All of the above are correct.
Correct Answer:

Verified
Correct Answer:
Verified
Q2: An adverse supply shock causes output to<br>A)rise.To
Q24: The Economy in 2008<br>In the first half
Q28: The Economy in 2008<br>In the first half
Q30: The short-run Phillips curve indicates that expansionary
Q46: The monetary-policy framework called inflation targeting is
Q58: In the long run, the natural rate
Q66: From 2008-2009 the Federal Reserve created a
Q72: In the long run,a decrease in the
Q140: If there is an adverse supply shock
Q221: In the early 1970s, the short-run Phillips