Multiple Choice
Exhibit 10-6 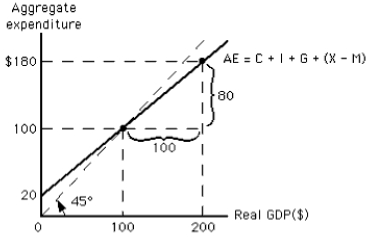
-According to the graph in Exhibit 10-6, if the price level increases, the new equilibrium level of real GDP must be
A) less than $20
B) less than $100
C) zero
D) greater than $100
E) greater than $200
Correct Answer:

Verified
Correct Answer:
Verified
Q6: Exhibit 10-5 <img src="https://d2lvgg3v3hfg70.cloudfront.net/TB4913/.jpg" alt="Exhibit 10-5
Q6: If autonomous consumption rises by $0.8 trillion
Q10: Exhibit 10-2<br> <img src="https://d2lvgg3v3hfg70.cloudfront.net/TB4913/.jpg" alt="Exhibit 10-2
Q17: If the price level increases,other things constant,consumption
Q29: The aggregate demand curve slopes downward to
Q40: If households save $40 billion less at
Q60: If the price level rises,<br>A)the aggregate expenditures
Q80: Aggregate expenditure means total or combined spending.
Q104: What is the effect of an increase
Q110: If the marginal propensity to consume in