Multiple Choice
Exhibit 11-7 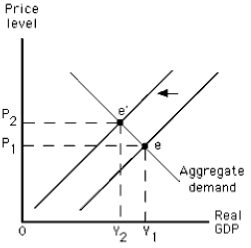
-The graph in Exhibit 11-7 shows a(n)
A) increase in short-run aggregate supply
B) increase in long-run aggregate supply
C) decrease in short-run aggregate supply
D) decrease in long-run aggregate supply
E) increase in aggregate quantity demanded
Correct Answer:

Verified
Correct Answer:
Verified
Q2: The short-run aggregate supply curve slopes upward
Q75: A wage in dollars measured by the
Q88: Given implicit or explicit resource price agreements,if
Q92: Exhibit 11-1<br> <img src="https://d2lvgg3v3hfg70.cloudfront.net/TB4913/.jpg" alt="Exhibit 11-1
Q95: Exhibit 11-4 <img src="https://d2lvgg3v3hfg70.cloudfront.net/TB4913/.jpg" alt="Exhibit 11-4
Q101: If nominal wage rates increase by 2
Q139: Which of the following would shift the
Q143: The aggregate supply curve reflects the relationship
Q157: Between 1994 and 2004,Jack's salary increased from
Q185: In the short run,but not in the