Multiple Choice
Figure 2.13 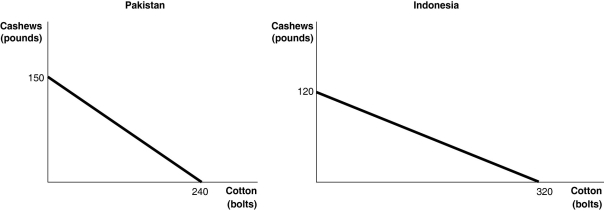 Figure 2.13 shows the production possibilities frontiers for Pakistan and Indonesia.Each country produces two goods, cotton and cashews.
Alt text for Figure 2.13: In figure 2.13, 2 graphs, show the production possibilities frontiers for Pakistan and Indonesia.
Long description for Figure 2.13: The graph on the left represents Pakistan.The x-axis is labelled, cotton in bolts, and the amount 240 marked.The y-axis is labelled, cashews in pounds, and the amount 150 is marked .A slanted line is drawn from point 150 on the y-axis to point 240 on the x-axis.The graph on the right represents Indonesia.The x-axis is labelled, cotton, in bolts, and the amount 320 is marked.The y-axis is labelled, cashews, in pounds, and the amount 120 marked.A slanted line is drawn from point 120 on the y-axis to point 320 on the x-axis.
-Refer to Figure 2.13.What is the opportunity cost of producing 1 pound of cashews in Indonesia?
A) 3/8 of a bolt of cotton
B) 5/8 of a bolt of cotton
C) 2 2/3 bolts of cotton
D) 320 bolts of cotton
Correct Answer:

Verified
Correct Answer:
Verified
Q15: When a celebrity has the desire to
Q71: What does the term "increasing marginal opportunity
Q94: The payment received by suppliers of entrepreneurial
Q136: It is not possible to have a
Q187: Table 2.5 <br><img src="https://d2lvgg3v3hfg70.cloudfront.net/TB3061/.jpg" alt="Table 2.5
Q189: Figure 2.22 <img src="https://d2lvgg3v3hfg70.cloudfront.net/TB3061/.jpg" alt="Figure 2.22
Q190: Table 2.11 <img src="https://d2lvgg3v3hfg70.cloudfront.net/TB3061/.jpg" alt="Table 2.11
Q196: Assume few people can be excellent surgeons
Q197: Which of the following countries is currently
Q228: The Great Depression of the 1930s, with