Multiple Choice
Figure 3.1 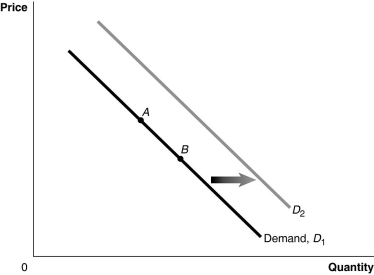 Alt text for Figure 3.1: In figure 3.1, graph of the effect of an increase in population on the demand curve.
Long description for Figure 3.1: The x-axis is labelled, Quantity, and y-axis is labelled, Price.Curve Demand, D1, is a straight line which slopes down from the top left corner to the bottom right corner.Curve D2 follows the same slope as curve D1, but is plotted to the right.2 points, A and B, are plotted in the middle of curve D1.A right pointing arrow indicates the change from curve D1 to curve D2.
-Refer to Figure 3.1.A case in which consumers no longer cared for a product would be represented by a movement from
A) A to B.
B) B to A.
C) D1 to D2.
D) D2 to D1.
Correct Answer:

Verified
Correct Answer:
Verified
Q46: A supply curve<br>A)is a table that shows
Q58: Figure 3.10 <img src="https://d2lvgg3v3hfg70.cloudfront.net/TB3061/.jpg" alt="Figure 3.10
Q59: If the price of gasoline increases, what
Q60: Once a good is considered inferior, it
Q61: If guarana (a key ingredient in many
Q64: Table 3.5 <img src="https://d2lvgg3v3hfg70.cloudfront.net/TB3061/.jpg" alt="Table 3.5
Q66: Figure 3.10 <img src="https://d2lvgg3v3hfg70.cloudfront.net/TB3061/.jpg" alt="Figure 3.10
Q67: For each of the following pairs of
Q68: Digital video recorders (DVRs or PVRs)were introduced
Q115: Which of the following is expected to