Multiple Choice
Figure 3.12 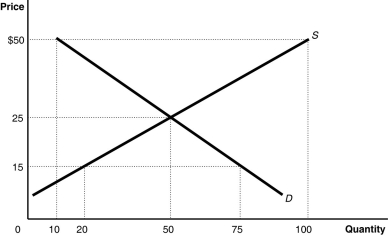 Alt text for Figure 3.12: In figure 3.23, a graph plotting intersecting supply and demand curves represents the market for coffee grinders.
Long description for Figure 3.12: The x-axis is labelled, Quantity, with the values 0, 10, 20, 50, 75, and 100 marked.The y-axis is labelled, Price, with the values 0, 15, 25, and 50 dollars marked.Curve D is a straight line which slopes down from the top left corner to the bottom right corner.Curve S is a straight line which begins in the bottom left corner and slopes up to the top right corner.The equilibrium of the 2 curves is (50,25) .The point plotted on curve S to the left of equilibrium is (20,15) .The point plotted on curve D to the right of point of equilibrium is (75,15) .The point plotted to the right of equilibrium on curve S is (100,50) .The point plotted to the right of the equilibrium on curve D is (10,50) .
-Refer to Figure 3.12.The figure above represents the market for coffee grinders.Assume that the price of coffee grinders is $50.At this price
A) the quantity supplied exceeds the quantity demanded by 100.The price will eventually fall to $25 where quantity demanded will equal quantity supplied.
B) the supply exceeds demand by 90.Some producers will have an incentive to offer to sell coffee grinders at a lower price.
C) there is a surplus equal to 90 coffee grinders that will be eliminated when the price falls to $25.
D) there is a surplus equal to 90 coffee grinders, and the price of coffee grinders will fall until demand is equal to supply.
Correct Answer:

Verified
Correct Answer:
Verified
Q37: If a firm has an incentive to
Q41: Which of the following is evidence of
Q72: If,in response to an increase in the
Q78: From a supply perspective, what impact would
Q210: The growing popularity of energy conservation has
Q211: In 2016, Canadian wheat and barley crops
Q213: Even when the demand for one good
Q214: Figure 3.15 <img src="https://d2lvgg3v3hfg70.cloudfront.net/TB3061/.jpg" alt="Figure 3.15
Q217: In much of Europe, the legal age
Q218: Explain the law of demand.