Multiple Choice
Figure 3.16 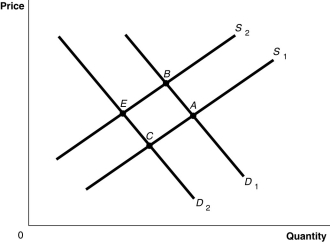 Alt text for Figure 3.16: In figure 3.16, a graph plotting intersecting demand and supply curves represents the change in equilibrium point in the motorcycle market with the increase in price of engines and wages of motorcycle manufacturers.
Long description for Figure 3.16: The x-axis is labelled, Quantity and the y-axis is labelled, Price.Curve D1 is a straight line which slopes down from the top left corner to the bottom right corner.Curve D2 is parallel with curve D1, but is plotted to the left.Curve S1 is a straight line which slopes up from the bottom right corner to the top left corner.Curve S2 is parallel to curve S1, but is plotted to the left.The 4 curves intersect at 4 points; A, B, on the right side of the lines, and C and D, on the left sides of the lines
-Refer to Figure 3.16.The graph in this figure illustrates an initial competitive equilibrium in the market for motorcycles at the intersection of D1 and S1 (point
A) The equilibrium point will move from A to E.
B) The equilibrium point will move from A to B.
C) The equilibrium point will move from A to C.
D) The equilibrium will first move from A to B, then return to A.
Correct Answer:

Verified
Correct Answer:
Verified
Q27: Electric car enthusiasts want to buy more
Q44: Market equilibrium occurs where the quantity supplied
Q174: Explain how it would be possible for
Q232: Tom Searchinger, a senior attorney at the
Q235: Factory incentives on cell phones have encouraged
Q236: Figure 3.4 <img src="https://d2lvgg3v3hfg70.cloudfront.net/TB3061/.jpg" alt="Figure 3.4
Q239: Figure 3.3 <img src="https://d2lvgg3v3hfg70.cloudfront.net/TB3061/.jpg" alt="Figure 3.3
Q240: A firm has an incentive to decrease
Q241: Figure 3.13 <img src="https://d2lvgg3v3hfg70.cloudfront.net/TB3061/.jpg" alt="Figure 3.13
Q242: Which of the following products would be