Multiple Choice
Figure 3.16 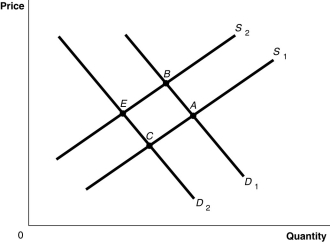 Alt text for Figure 3.16: In figure 3.16, a graph plotting intersecting demand and supply curves represents the change in equilibrium point in the motorcycle market with the increase in price of engines and wages of motorcycle manufacturers.
Long description for Figure 3.16: The x-axis is labelled, Quantity and the y-axis is labelled, Price.Curve D1 is a straight line which slopes down from the top left corner to the bottom right corner.Curve D2 is parallel with curve D1, but is plotted to the left.Curve S1 is a straight line which slopes up from the bottom right corner to the top left corner.Curve S2 is parallel to curve S1, but is plotted to the left.The 4 curves intersect at 4 points; A, B, on the right side of the lines, and C and D, on the left sides of the lines
-Refer to Figure 3.16.The graph in this figure illustrates an initial competitive equilibrium in the market for motorcycles at the intersection of D2 and S1 (point
A) a positive change in the technology used to produce motorcycles and a decrease in the price of motorcycle insurance (a complement to motorcycles)
B) an increase in the wages of motorcycle workers and a decrease in the price of motorcycle insurance (a complement to motorcycles)
C) an increase in the number of motorcycle producers and an increase in the number of consumers who prefer riding motorcycles
D) an increase in the wages of motorcycle workers and an increase in the price of motorcycle insurance (a complement to motorcycles)
Correct Answer:

Verified
Correct Answer:
Verified
Q35: By drawing a demand curve with price
Q95: Olive oil producers want to sell more
Q96: An inferior good is a good for
Q171: What are the five most important variables
Q304: Indicate whether each of the following situations
Q305: If Canada bans the importation of beluga
Q307: The popularity of digital cameras has enticed
Q310: If you are considering buying an energy
Q311: Figure 3.15 <img src="https://d2lvgg3v3hfg70.cloudfront.net/TB3061/.jpg" alt="Figure 3.15
Q313: Figure 3.13 <img src="https://d2lvgg3v3hfg70.cloudfront.net/TB3061/.jpg" alt="Figure 3.13