Multiple Choice
Table 5.8 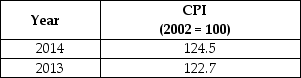
-Refer to Table 5.8.Suppose that the data in the table above reflect price levels in the economy.What is the inflation rate between 2013 and 2014?
A) 1.5%
B) 1.8%
C) 22.7%
D) 24.5%
E) 101%
Correct Answer:

Verified
Correct Answer:
Verified
Related Questions
Q44: If inflation is completely anticipated,<br>A)no one loses
Q45: Statistics Canada would categorize a person as
Q48: Figure 5.1 <img src="https://d2lvgg3v3hfg70.cloudfront.net/TB3061/.jpg" alt="Figure 5.1
Q51: Suppose that in 2019, all prices in
Q52: Shelter is the largest component of the
Q53: The labour force survey is compiled from
Q54: If you want to earn a real
Q60: What is the difference between the nominal
Q89: The inflation rate measures the average prices
Q165: Efficiency wage is another name for the