Multiple Choice
Table 5.9 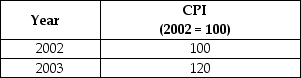
-Refer to Table 5.9.Suppose that the data in the table above reflect the price levels in the economy.What is the inflation rate in between 2002 and 2003?
A) 2%
B) 5%
C) 10%
D) 12%
E) 20%
Correct Answer:

Verified
Correct Answer:
Verified
Related Questions
Q76: A central concept in macroeconomics is the
Q80: The percent increase in the CPI from
Q81: The increased generosity of unemployment insurance programs
Q82: The producer price index measures the prices
Q83: Statistics Canada counts as employed people who
Q86: Jack just received a promotion at work
Q88: The unemployment rate is<br>A)the percentage of the
Q89: The labour force participation rate equals the<br>A)(number
Q90: You borrow $10,000 from a bank for
Q273: What is the natural rate of unemployment,and