Multiple Choice
Table 5.19 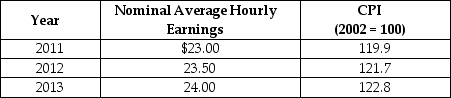
-Refer to Table 5.19.Looking at the table above, what is the rate of growth of the average price level from 2012 to 2013?
A) 0.9%
B) 1.5%
C) 2%
D) 2.6%
E) 5.25%
Correct Answer:

Verified
Correct Answer:
Verified
Related Questions
Q119: Describe how a lender can lose during
Q161: The equilibrium wage in a local labour
Q163: Table 5.4 <img src="https://d2lvgg3v3hfg70.cloudfront.net/TB3061/.jpg" alt="Table 5.4
Q164: Someone who is available for work but
Q165: The most important group not identified by
Q167: If the CPI rises from 206.7 to
Q168: Which of the following would decrease the
Q169: Suppose the government launches a successful advertising
Q171: Most economists believe that the biases in
Q201: Nominal income is equal to real income