Multiple Choice
Figure 7.3 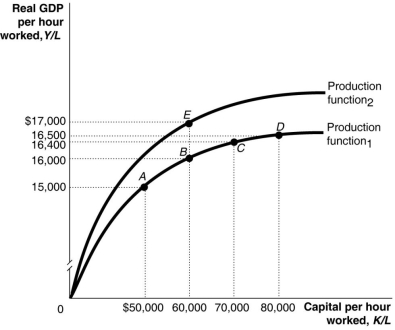 Alt text for Figure 7.3: In figure 7.3, a graph, comparing capital per hour worked and real GDP per hour worked.
Long description for Figure 7.3: The x-axis is labelled, capital per hour worked, K/L.The y-axis is labelled, real GDP per hour worked, Y/L.2 concave curves originating from 0 at the vertex are shown.5 points A ($50000, $15000) , B ($60000, $16000) , C ($70000, $16400) , D ($80000, $16500) , and E ($60000, $17000) are plotted.The curve labelled Production function 1, passes through points A, B, C, and D.The curve labelled Production function 2, passes through point E.These 5 points are connected to their respective coordinates on the x and y-axis with dotted lines.
-Refer to Figure 7.3. A large group of new workers entering the labour force is shown in the figure above by a movement from
A) C to B.
B) A to B.
C) B to E.
D) E to B.
E) C to D.
Correct Answer:

Verified
Correct Answer:
Verified
Q93: Because of diminishing returns to capital, further
Q94: Suppose that in 2011 real GDP grew
Q96: The economic growth model predicts that<br>A)GDP per
Q97: Which of the following is not a
Q99: The purchase by an individual or firm
Q101: Table 7.6 <img src="https://d2lvgg3v3hfg70.cloudfront.net/TB3061/.jpg" alt="Table 7.6
Q102: Figure 7.3 <img src="https://d2lvgg3v3hfg70.cloudfront.net/TB3061/.jpg" alt="Figure 7.3
Q103: Figure 7.1 <img src="https://d2lvgg3v3hfg70.cloudfront.net/TB3061/.jpg" alt="Figure 7.1
Q220: Explain how advances in technology are critical
Q245: The per-worker production function has a _