Multiple Choice
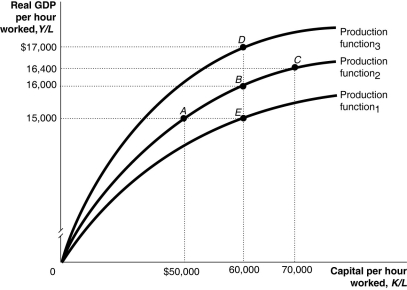
Figure 7.4  Alt text for Figure 7.4: In figure 7.4, a graph representing per-worker production functions.
Long description for Figure 7.4: The x-axis is labelled, capital per hour worked, K/L.The y-axis is labelled, real GDP per hour worked, Y/L.3 concave curves originating from 0 at the vertex are shown.5 points A ($50000, $15000) , B ($60000, $16000) , C ($70000, $16400) , D ($60000, $17000) , and E ($60000, $15000) are plotted.The curve labelled, Production function 1, passes through point E.The curve labelled, Production function 2, passes through points A, B, and C.The curve labelled, Production function 3, passes through point D.These 5 points are connected to their respective coordinates on the x-axis and y-axis with dotted lines.
-Refer to Figure 7.4.The movement from E to B to D in the figure above illustrates
A) an improvement in technology.
B) a decline in capital per worker.
C) diminishing returns to capital.
D) diminishing returns to labour.
E) an increase in the price level.
Correct Answer:

Verified
Correct Answer:
Verified
Q21: One reason why many low-income countries experience
Q78: An economy that grows too slowly fails
Q111: Only income can produce increases in standard
Q112: If real GDP per capita in Canada
Q113: Foreign direct investment occurs when a Chinese
Q116: Which of the following would you expect
Q117: If real GDP per capita in Canada
Q119: High-income countries are also referred to as<br>A)developing
Q178: A policy that offers parents a tax
Q201: Describe the process of "creative destruction" using