Essay
Using the points on the diagram below, identify which combinations of these points illustrate diminishing returns to capital.Give a brief explanation to support your answer. 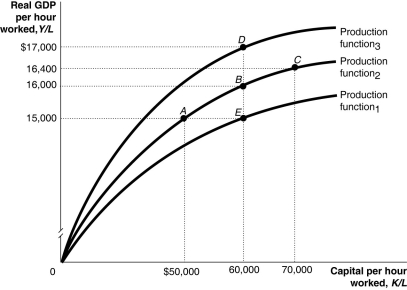 Alt text for Question 101: For question 101, a graph illustrating diminishing returns to capital
Long description for Question 101: The x-axis is labelled, capital per hour worked, K/L.The y-axis is labelled, real GDP per hour worked, Y/L.3 concave curves originating from 0 at the vertex are shown.5 points A ($50000, 15000), B (60000, 16000), C (70000, 16400), D (60000, $17000), and E (60000, 15000)are plotted.The curve labelled, Production function 1, passes through point E.The curve labelled, Production function 2, passes through points A, B, and C.The curve labelled, Production function 3, passes through point D.These 5 points are connected to their respective coordinates on the x and y-axis with dotted lines.
Correct Answer:

Verified
The movement from A to B to C illustrate...View Answer
Unlock this answer now
Get Access to more Verified Answers free of charge
Correct Answer:
Verified
View Answer
Unlock this answer now
Get Access to more Verified Answers free of charge
Q11: Creative destruction means that<br>A)firms develop new products
Q12: What is the difference between foreign direct
Q13: GDP in a country grew from $10
Q15: The term "brain drain" refers to<br>A)highly educated
Q17: If the slope of the per-worker production
Q18: Paul Romer, an economist at Stanford University,
Q20: Given the fact that the productivity slowdown
Q21: Because of the productivity slowdown in Canada
Q184: You have been hired as an economic
Q210: Draw a graph of "catch-up" that shows