Multiple Choice
Figure 7.5 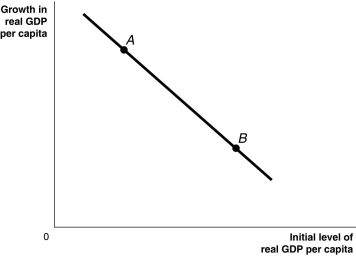 Alt text for Figure 7.5: In figure 7.5, a graph depicting the "catch-up line."
Long description for Figure 7.5: The x-axis is labelled, initial level of real GDP per capita.The y-axis is labelled, growth in real GDP per capita.A line slopes down from the top left corner to the end of the x-axis.2 points, A and B, are plotted on this line such that point A is on the top part of the line, and point B is on the bottom part of the line.
-Refer to Figure 7.5.Based on the "catch-up line" drawn above, poorer countries are more likely to be at a point like ________, where growth in GDP is relatively ________, while richer countries are more likely to be at a point like ________, where growth in GDP is relatively ________.
A) A; low; B; high
B) A; high; B; low
C) B; low; A; high
D) B; high; A; low
E) A; high; B; high
Correct Answer:

Verified
Correct Answer:
Verified
Q66: Table 7.7 <img src="https://d2lvgg3v3hfg70.cloudfront.net/TB3061/.jpg" alt="Table 7.7
Q67: If an outflow of workers leaves a
Q68: Secular stagnation is NOT caused by<br>A)slowing population
Q69: In 1973, the Club of Rome published
Q70: There has been catch-up among the _
Q73: Which of the following best explains why
Q74: Disease, poor nutrition, and substandard health care
Q75: Why would knowledge capital exhibit increasing returns
Q76: Political stability is not a prerequisite to
Q76: Foreign direct investment in Canada increased 3.8