Multiple Choice
Figure 8.1 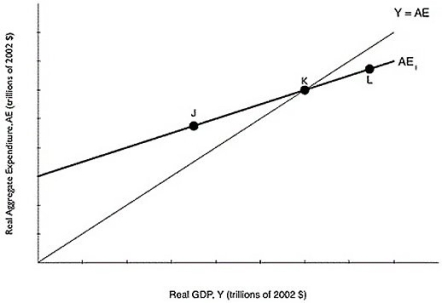 Alt text for Figure 8.1: In figure 8.1, a graph comparing real GDP and real aggregate expenditure.
Long description for Figure 8.1: The x-axis is labelled, real GDP, Y (trillions of 2002 dollars) .The y-axis is labelled, real aggregate expenditure, AE (trillions of 2002 dollars) .A line, labelled Y = AE, originates at the vertex and slopes up to the top right corner.Another line, labelled AE1, begins a little less than half way along the x-axis and slopes up to the end of the x-axis.Both these lines intersect at point K, approximately three quarters of the way along both lines.Point J is plotted a little less than half way along the line AE1, to the left of point K.Point L is plotted close to the right end of the line AE1, to the right of point K.
-Refer to Figure 8.1.According to the figure above, at what point is aggregate expenditure greater than GDP?
A) J
B) K
C) L
D) none of the above
Correct Answer:

Verified
Correct Answer:
Verified
Q12: Explain,in detail,how the adjustment to macroeconomic equilibrium
Q92: The marginal propensity to consume is the
Q285: During a(n)_ many firms experience increased profits,
Q286: The multiplier is calculated as the change
Q288: Which of the following will decrease aggregate
Q289: Investment spending will increase when<br>A)the interest rate
Q291: Figure 8.4 <img src="https://d2lvgg3v3hfg70.cloudfront.net/TB3061/.jpg" alt="Figure 8.4
Q293: Consumption spending is $22 million, planned investment
Q294: If firms find that consumers are purchasing
Q295: The marginal propensity to save is defined