Multiple Choice
Figure 8.1 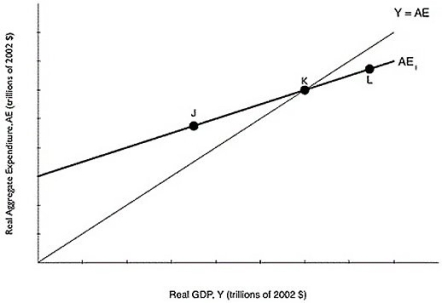 Alt text for Figure 8.1: In figure 8.1, a graph comparing real GDP and real aggregate expenditure.
Long description for Figure 8.1: The x-axis is labelled, real GDP, Y (trillions of 2002 dollars) .The y-axis is labelled, real aggregate expenditure, AE (trillions of 2002 dollars) .A line, labelled Y = AE, originates at the vertex and slopes up to the top right corner.Another line, labelled AE1, begins a little less than half way along the x-axis and slopes up to the end of the x-axis.Both these lines intersect at point K, approximately three quarters of the way along both lines.Point J is plotted a little less than half way along the line AE1, to the left of point K.Point L is plotted close to the right end of the line AE1, to the right of point K.
-Refer to Figure 8.1.If the economy is at point L, what will happen?
A) Inventories have fallen below their desired level, and firms decrease production.
B) Inventories have fallen below their desired level, and firms increase production.
C) Inventories have risen above their desired level, and firms decrease production.
D) Inventories have risen above their desired level, and firms increase production.
Correct Answer:

Verified
Correct Answer:
Verified
Q5: Disposable income is defined as<br>A)national income -
Q61: An unplanned increase in inventories results from<br>A)an
Q62: The change in consumption divided by the
Q64: Given the equations for C, I, G,
Q65: All of the following are components of
Q67: If an increase in autonomous consumption spending
Q69: Into which category of aggregate expenditure would
Q70: The consumption function describes the relationship between<br>A)consumption
Q71: The key idea of the aggregate expenditure
Q184: If planned investment is equal to actual