Multiple Choice
Figure 8.3 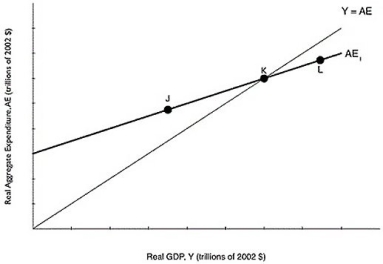 Alt text for Figure 8.3: In figure 8.3, a graph comparing real GDP and real aggregate expenditure.
Long description for Figure 8.3: The x-axis is labelled, real GDP, Y (trillions of 2002 dollars) .The y-axis is labelled, real aggregate expenditure, AE (trillions of 2002 dollars) .Line Y = AE, originates at the vertex and slopes up to the top right corner.Line AE1, begins a little less than half way along the x-axis and slopes up to the end of the x-axis.Both these lines intersect at point K, approximately 3 quarters of the way along both lines.Point J is plotted a little less than half way along line AE1, to the left of point K.Point L is marked close to the right end of the line AE1, to the right of point K.
-Refer to Figure 8.3.At point J in the figure above, which of the following is true?
A) Aggregate expenditure is less than GDP.
B) The economy has achieved macroeconomic equilibrium.
C) Actual inventories are less than planned inventories.
D) GDP will be decreasing.
E) unemployment will be rising.
Correct Answer:

Verified
Correct Answer:
Verified
Q149: On the 45-degree line diagram, for points
Q151: Consumption is $5 billion, planned investment spending
Q152: If the consumption function is defined as
Q153: Investment spending increases during _, and decreases
Q155: Table 8.7 <img src="https://d2lvgg3v3hfg70.cloudfront.net/TB3061/.jpg" alt="Table 8.7
Q157: Given Table 8.6 below, fill in the
Q158: If the MPC is 0.95, then a
Q159: In the aggregate expenditure model, _ has
Q243: The larger the MPC,the smaller the value
Q247: If planned investment is greater than actual