Multiple Choice
Figure 8.3 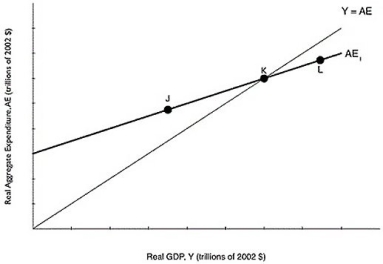 Alt text for Figure 8.3: In figure 8.3, a graph comparing real GDP and real aggregate expenditure.
Long description for Figure 8.3: The x-axis is labelled, real GDP, Y (trillions of 2002 dollars) .The y-axis is labelled, real aggregate expenditure, AE (trillions of 2002 dollars) .Line Y = AE, originates at the vertex and slopes up to the top right corner.Line AE1, begins a little less than half way along the x-axis and slopes up to the end of the x-axis.Both these lines intersect at point K, approximately 3 quarters of the way along both lines.Point J is plotted a little less than half way along line AE1, to the left of point K.Point L is marked close to the right end of the line AE1, to the right of point K.
-Refer to Figure 8.3.If the economy is at point J, what will happen?
A) Inventories have fallen below their desired level, so firms will decrease production.
B) Inventories have fallen below their desired level, so firms will increase production.
C) Inventories have risen above their desired level, so firms will decrease production.
D) Inventories have risen above their desired level, so firms will increase production.
Correct Answer:

Verified
Correct Answer:
Verified
Q294: If firms find that consumers are purchasing
Q295: The marginal propensity to save is defined
Q296: Which of the following will increase aggregate
Q297: MPC + MPS =<br>A)0.<br>B)0.25.<br>C)0.5.<br>D)1.<br>E)100%.
Q298: Which of the following is a true
Q300: Which is the smallest component of aggregate
Q301: All of the following are true statements
Q302: If firms sell what they expected to
Q303: Ceteris paribus, how does a recession in
Q304: Suppose Canada experiences a long period of