Multiple Choice
Figure 8.3 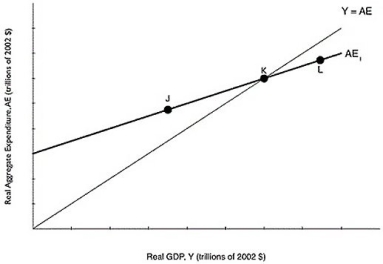 Alt text for Figure 8.3: In figure 8.3, a graph comparing real GDP and real aggregate expenditure.
Long description for Figure 8.3: The x-axis is labelled, real GDP, Y (trillions of 2002 dollars) .The y-axis is labelled, real aggregate expenditure, AE (trillions of 2002 dollars) .Line Y = AE, originates at the vertex and slopes up to the top right corner.Line AE1, begins a little less than half way along the x-axis and slopes up to the end of the x-axis.Both these lines intersect at point K, approximately 3 quarters of the way along both lines.Point J is plotted a little less than half way along line AE1, to the left of point K.Point L is marked close to the right end of the line AE1, to the right of point K.
-Refer to Figure 8.3.If the economy is in equilibrium, it is at a level of aggregate expenditure given by point
A) J)
B) K)
C) L)
D) Points J, K, and L all represent equilibrium.
Correct Answer:

Verified
Correct Answer:
Verified
Q71: Explain how a stock market crash has
Q105: If consumption is defined as C =
Q245: The difference between GDP and disposable income
Q246: If firms find that consumers are purchasing
Q247: When aggregate expenditure = GDP<br>A)macroeconomic equilibrium occurs.<br>B)the
Q248: Which of the following will cause a
Q252: Increases in the price level will<br>A)lower consumption
Q253: The slope of the consumption function is
Q254: Figure 8.1 <img src="https://d2lvgg3v3hfg70.cloudfront.net/TB3061/.jpg" alt="Figure 8.1
Q255: Given Table 8.4 below, fill in the