Multiple Choice
Figure 8.7 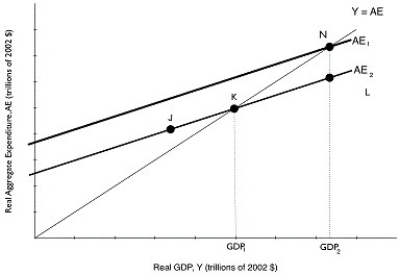 Alt text for Figure 8.7: In figure 8.7, a graph comparing real GDP and real aggregate expenditure.
Long description for Figure 8.7: The x-axis is labelled, real GDP, Y (trillions of 2002 dollars) .The y-axis is labelled, real aggregate expenditure, AE (trillions of 2002 dollars) .Line AE1, begins a little less than half way along the x-axis and slopes up to the end of the x-axis.Line AE2, is to the right of AE1 and is on a similar path as line AE1, sloping up to the top right corner.Line Y = AE, originates at the vertex and slopes up to the top right corner.Line Y = AE meets line AE2 at point K, half way along both the lines, and meets line AE1 at point N, plotted close to the right end of line AE1.Point J is plotted a little less than half way along line AE2, to the left of point K.Point L is marked close to the right end of line AE2, to the right of point K.
-Refer to Figure 8.7.Suppose that investment spending decreases by $5 million, decreasing aggregate expenditure and decreasing real GDP from GDP2 to GDP1.If the MPC is 0.8, then what is the change in GDP?
A) -$4 million
B) -$5 million
C) -$25 million
D) -$40 million
E) -$50 million
Correct Answer:

Verified
Correct Answer:
Verified
Q48: C = 2,550 + (MPC)Y<br>I = 800<br>G
Q213: Table 8.15 <img src="https://d2lvgg3v3hfg70.cloudfront.net/TB3061/.jpg" alt="Table 8.15
Q214: Planned aggregate expenditure is equal to<br>A)consumption spending
Q215: Equations for C, I, G, and NX
Q216: Figure 8.6 <img src="https://d2lvgg3v3hfg70.cloudfront.net/TB3061/.jpg" alt="Figure 8.6
Q217: If the consumption function is defined as
Q219: A decrease in the real interest rate
Q220: How does a decrease in government spending
Q221: If inflation in Canada is lower than
Q222: Consumption spending is $5 million, planned investment