Multiple Choice
Figure 8.7 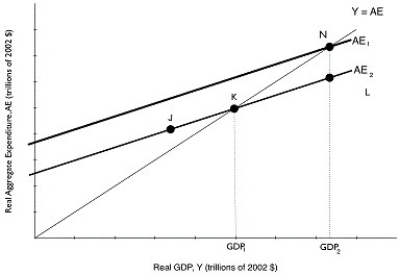 Alt text for Figure 8.7: In figure 8.7, a graph comparing real GDP and real aggregate expenditure.
Long description for Figure 8.7: The x-axis is labelled, real GDP, Y (trillions of 2002 dollars) .The y-axis is labelled, real aggregate expenditure, AE (trillions of 2002 dollars) .Line AE1, begins a little less than half way along the x-axis and slopes up to the end of the x-axis.Line AE2, is to the right of AE1 and is on a similar path as line AE1, sloping up to the top right corner.Line Y = AE, originates at the vertex and slopes up to the top right corner.Line Y = AE meets line AE2 at point K, half way along both the lines, and meets line AE1 at point N, plotted close to the right end of line AE1.Point J is plotted a little less than half way along line AE2, to the left of point K.Point L is marked close to the right end of line AE2, to the right of point K.
-Refer to Figure 8.7.Suppose that government spending increases, shifting up the aggregate expenditure line.GDP increases from GDP1 to GDP2, and this amount is $200 billion.If the MPC is 0.8, then what is the distance between N and L, or by how much did government spending change?
A) $16 billion
B) $40 billion
C) $160 billion
D) $200 billion
E) $1,000 billion
Correct Answer:

Verified
Correct Answer:
Verified
Q167: When Jack's income increases by $1,000,he spends
Q225: A/an _ in taxes will decrease consumption
Q227: Actual investment spending includes spending by consumers
Q228: The ratio of the increase in _
Q229: What impact does an increase in the
Q231: A decrease in the price level in
Q232: If the marginal propensity to consume is
Q233: Investment spending will decrease when<br>A)the interest rate
Q234: An increase in the price level in
Q235: Autonomous expenditure times the multiplier equals<br>A)autonomous saving.<br>B)autonomous