Multiple Choice
Figure 8.8 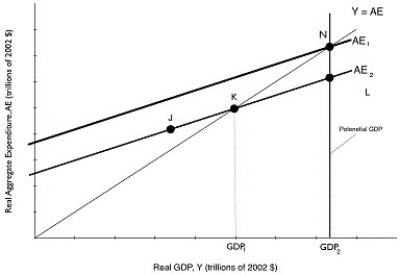 Alt text for Figure 8.8: In figure 8.8, a graph depicting potential GDP.
Long description for Figure 8.8: The x-axis is labelled, real GDP, Y (trillions of 2002 dollars) with values GDP1 and GDP2 marked.The y-axis is labelled, real aggregate expenditure, AE (trillions of 2002 dollars) .Line AE1, begins a little less than half way on the x-axis and slopes up to the end of the x-axis.Line AE2, is to the right of AE1 and is on a similar path, sloping up to the top right corner.Line Y = AE, originates at the vertex and slopes up to the top right corner.Line Y = AE intersects line AE2 at point K, half way along both lines, and intersects line AE1 at point N, plotted close to the right end of line AE1.Point J is plotted a little less than half way along line AE2, to the left of point K.Point L is plotted close to the right end of line AE2, to the right of point K.Point K is connected to its x-coordinate, GDP1, with a dotted line.A straight line, representing potential GDP, is drawn connecting points N and L with their x-coordinate, GDP2, such that it is parallel to line connecting point K with value GDP1.
-Refer to Figure 8.8.Potential GDP equals $500 billion.The economy is currently producing GDP1, which is equal to $450 billion.If the MPC is 0.8, then how much must autonomous spending change for the economy to move to potential GDP?
A) -$40 billion
B) -$10 billion
C) $10 billion
D) $40 billion
E) $50 billion
Correct Answer:

Verified
Correct Answer:
Verified
Q70: What is the difference between aggregate expenditure
Q73: Assume you are given the following information
Q74: The decrease in consumer spending during the
Q75: _ spending follows a smooth trend whereas,
Q75: If the marginal propensity to save is
Q76: As a result of the drop in
Q77: _ is defined as national income +
Q80: _ consumption is consumption that depends upon
Q81: An unplanned decrease in inventories results in<br>A)a
Q114: Macroeconomic equilibrium can occur at any point