Multiple Choice
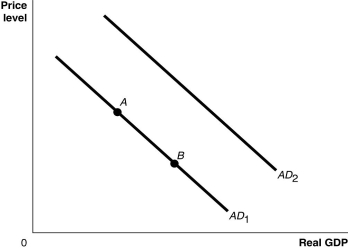
Figure 9.1  Alt text for Figure 9.1: In figure 9.1, a graph comparing real GDP and price level.
Long description for Figure 9.1: The x-axis is labelled, real GDP, and the y-axis is labelled, price level, with 0 at the vertex.Line AD1 begins in the top left corner and slopes down to the bottom center.Line AD2 follows the same slope as line AD1 but is plotted to the right.Points A and B are plotted along line AD1.Point A is a little less than half way along the left side of the line, and point B is little more than half way on the right side of the line.
-Refer to Figure 9.1.Ceteris paribus, an increase in the value of the domestic currency relative to foreign currencies would be represented by a movement from
A) AD1 to AD2.
B) AD2 to AD1.
C) point A to point B.
D) point B to point A.
Correct Answer:

Verified
Correct Answer:
Verified
Q24: An increase in government spending will result
Q174: When potential GDP increases,long-run aggregate supply also
Q207: _ of unemployment during _ make it
Q209: Deflation will<br>A)increase aggregate demand.<br>B)increase the quantity of
Q210: In the long run,<br>A)total unemployment = frictional
Q212: Figure 9.8 <img src="https://d2lvgg3v3hfg70.cloudfront.net/TB3061/.jpg" alt="Figure 9.8
Q213: Many economists believe that increases in government
Q214: A negative supply shock in the short
Q215: Which of the following is considered a
Q216: Workers expect inflation to fall from 4%