Multiple Choice
Figure 9.5 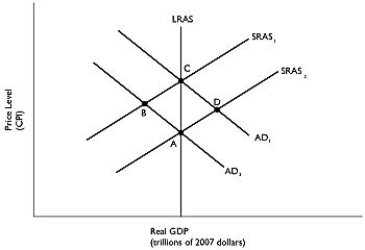 Alt text for Figure 9.5: In figure 9.5, a graph comparing real GDP and price level.
Long description for Figure 9.5: The x-axis is labelled, real GDP (trillions of 2007 dollars) , and the y-axis is labelled, price level (CPI) .5 lines are shown; SRAS1, SRAS2, AD1, AD2, and LRAS.Line SRAS1 begins above the vertex and slopes up to the top right corner.Line SRAS2 follows the same slope as line SRAS1, but is plotted to the right.Line AD1 begins at the top left corner and slopes down to the bottom center.Line AD2 follows the same slope as AD1, but is plotted to the right.Line SRAS1 intersects line AD1 at point C, more than half way along both the lines.Line SRAS1 intersects line AD2 at point B, approximately 3 quarters of the way along both lines.Line SRAS2 intersects line AD1 at point D, approximately 3 quarters of the way along both lines.Line SRAS2 intersects line AD2 at point A, more than half way along both lines.Line LRAS is perpendicular to the x-axis, passing through the points A and C, and intersecting all the 4 lines.
-Refer to Figure 9.5.Which of the points in the above graph are possible short-run equilibria but not long-run equilibria? Assume that Y1 represents potential GDP.
A) A and B
B) A and C
C) B and C
D) C and D
E) B and D
Correct Answer:

Verified
Correct Answer:
Verified
Q52: The dynamic aggregate demand and aggregate supply
Q120: In Canada, because shipping plays such an
Q121: Canada suffered a mini recession in the
Q122: On the long-run aggregate supply curve,<br>A)an increase
Q124: Economists and industry analysts pay close attention
Q126: Which of the following would cause the
Q128: Figure 9.5 <img src="https://d2lvgg3v3hfg70.cloudfront.net/TB3061/.jpg" alt="Figure 9.5
Q129: A rapid increase in the price of
Q188: An increase in aggregate demand results in
Q199: An increase in exports decreases aggregate demand.