Multiple Choice
Figure 9.5 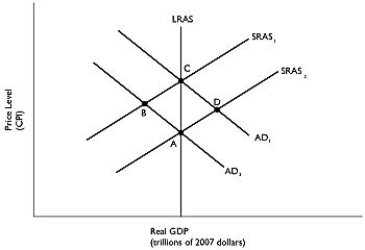 Alt text for Figure 9.5: In figure 9.5, a graph comparing real GDP and price level.
Long description for Figure 9.5: The x-axis is labelled, real GDP (trillions of 2007 dollars) , and the y-axis is labelled, price level (CPI) .5 lines are shown; SRAS1, SRAS2, AD1, AD2, and LRAS.Line SRAS1 begins above the vertex and slopes up to the top right corner.Line SRAS2 follows the same slope as line SRAS1, but is plotted to the right.Line AD1 begins at the top left corner and slopes down to the bottom center.Line AD2 follows the same slope as AD1, but is plotted to the right.Line SRAS1 intersects line AD1 at point C, more than half way along both the lines.Line SRAS1 intersects line AD2 at point B, approximately 3 quarters of the way along both lines.Line SRAS2 intersects line AD1 at point D, approximately 3 quarters of the way along both lines.Line SRAS2 intersects line AD2 at point A, more than half way along both lines.Line LRAS is perpendicular to the x-axis, passing through the points A and C, and intersecting all the 4 lines.
-Refer to Figure 9.5.Suppose the economy is at point A.If consumer spending increases in the economy, where will the eventual long-run equilibrium be?
A) A
B) B
C) C
D) D
E) None of these points are long-run equilibria.
Correct Answer:

Verified
Correct Answer:
Verified
Q36: Using the aggregate supply and demand model,illustrate
Q220: The "interest rate effect" can be described
Q222: Which of the following is one explanation
Q223: A decrease in aggregate demand results in
Q226: Which of the following could explain why
Q227: Figure 9.6 <img src="https://d2lvgg3v3hfg70.cloudfront.net/TB3061/.jpg" alt="Figure 9.6
Q228: Changes in the price level<br>A)increase the level
Q229: Figure 9.6 <img src="https://d2lvgg3v3hfg70.cloudfront.net/TB3061/.jpg" alt="Figure 9.6
Q230: The automatic mechanism _ the price level
Q268: After an unexpected _ in the price