Multiple Choice
Figure 9.6 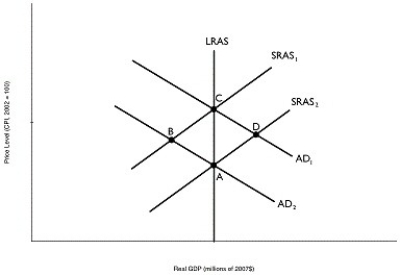 Alt text for Figure 9.6: In figure 9.6, a graph depicting short-run equilibrium and long-run equilibrium.
Long description for Figure 9.6: The x-axis is labelled, real GDP (trillions of 2007 dollars) , and the y-axis is labelled, price level (CPI) .5 lines are shown; SRAS1, SRAS2, AD1, AD2, and LRAS.Line SRAS1 begins near the bottom left and slopes up to the top right corner.Line SRAS2 follows the same slope as line SRAS1, but is plotted to the right.Line AD1 begins at the top left corner and slopes down to the bottom center.Line AD2 follows the same slope as AD1, but is plotted to the right.Line SRAS1 intersects line AD1 at point C, more than half way along both lines.Line SRAS1 intersects line AD2 at point B, approximately 3 quarters of the way along both lines.Line SRAS2 intersects line AD1 at point D, approximately 3 quarters of the way along both lines.Line SRAS2 intersects the line AD2 at point A, more than half way along both lines.Line LRAS is perpendicular to the x-axis, passing through points A and C and intersecting all 4 lines.
-Refer to Figure 9.6.Which of the points in the above graph are possible long-run equilibria?
A) A and B
B) A and C
C) B and D
D) B and C
E) C and D
Correct Answer:

Verified
Correct Answer:
Verified
Q139: If the Canadian dollar decreases in value
Q140: Suppose a developing country receives more machinery
Q141: Figure 9.3 <img src="https://d2lvgg3v3hfg70.cloudfront.net/TB3061/.jpg" alt="Figure 9.3
Q142: Figure 9.8 <img src="https://d2lvgg3v3hfg70.cloudfront.net/TB3061/.jpg" alt="Figure 9.8
Q143: Which of the following best describes the
Q145: Changes in _ do not affect the
Q146: Suppose there has been an increase in
Q147: Suppose the economy is at full employment
Q148: _ of unemployment during _ make it
Q149: The level of aggregate supply in the