Multiple Choice
Figure 9.7 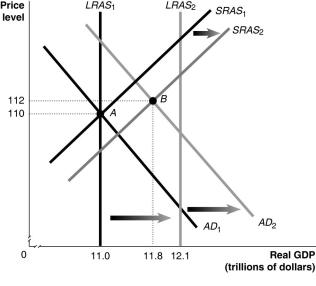 Alt text for Figure 9.7: In figure 9.7, a graph comparing real GDP and price level.
Long description for Figure 9.7: The x-axis is labelled, real GDP (trillions of dollars) , with values 11.0, 11.8, 12.1 marked.The y-axis is labelled, price level, with values 110 and 112 marked.6 lines are shown; SRAS1, SRAS2, AD1, AD2, LRAS1, LRAS2.Line SRAS1 begins near the bottom left and slopes up to the top right corner.Line SRAS2 follows the same slope as line SRAS1, but is plotted to the right.The area between lines SRAS1 and SRAS2 is indicated by a right pointing arrow.Line AD1 begins at the top left corner and slopes down toward the bottom center.Line AD2 follows the same slope as AD1, but is plotted to the right.The area between lines AD1 and AD2 is indicated by a right pointing arrow.Line LRAS1 is perpendicular to the x-axis, and begins from value 11.0.Line LRAS2 perpendicular to the x-axis, and begins from point 12.1.The area between lines LRAS1 and LRAS2 is indicated by a right pointing arrow.Line LRAS1 intersects lines AD1 and SRAS1 at point A (11.0, 110) .Lines AD2 and SRAS2 intersect at point B (11.8, 112) .Points A and B are connected to their respective coordinates on the x-axis and y-axis with dotted lines.Line LRAS2 intersects lines SRAS1 and SRAS2 on the right end of these lines.Similarly, line LRAS2 intersects lines AD1 and AD2 on the right end of these lines.
-Refer to Figure 9.7.In the figure above, LRAS1 and SRAS1 denote LRAS and SRAS in year 1, while LRAS2 and SRAS2 denote LRAS and SRAS in year 2.Given the economy is at point A in year 1, what is the growth rate in potential GDP in year 2?
A) 2%
B) 8%
C) 9.1%
D) 10%
E) 12%
Correct Answer:

Verified
Correct Answer:
Verified
Q51: In the dynamic aggregated demand and aggregate
Q52: An increase in investment causes the price
Q53: Figure 9.1 <img src="https://d2lvgg3v3hfg70.cloudfront.net/TB3061/.jpg" alt="Figure 9.1
Q54: Suppose Canadian GDP growth rate is faster
Q55: The long-run aggregate supply curve<br>A)has a negative
Q57: Which of the following is one explanation
Q60: When the price of oil falls unexpectedly,
Q78: An increase in the price level causes
Q119: The long-run aggregate supply curve is vertical.
Q155: What is a supply shock,and why might